
Grid Case Group’s are designed to make it easy to calculate statistics per cell and per time step of a large number of Eclipse simulation Cases with identical Grids (often labeled realizations).
If you have several Eclipse simulations with different input parameters available, you can put all the realizations into a Grid Case Group and easily calculate each of the cells mean value, range and max/min values at each time step between the realizations.
Creating Grid Case Groups
From Files
The easiest way to create a Grid Case Group is to use the Import command: File->Import->Eclipse Cases->Create Grid Case Group from Files or File->Import->Eclipse Cases->Create Grid Case Group from Files Recursively
The latter command will display the recursive file import dialog described on the Summary Plots page.
The first command will display the “old” import dialog:
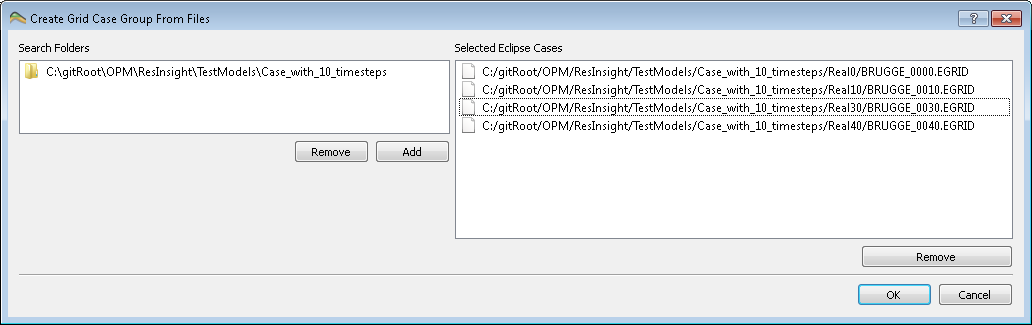
- Add one or more search folders to the list on the left.
- The EGRID or GRID files found in these directories and sub directories are shown in the list to the right.
- If you want to remove some EGRID files from the list, select them and press the Remove button.
- When you are ready, press the OK button.
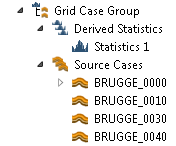
ResInsight then creates a Grid Case Group for you, and populates its Source Cases with the Cases you selected. Then the first of those Cases are read completely, while the others are just scanned to verify that the Grids match and to detect changes in the Active Cells layout. This makes it quite fast to load even a quite large number of realizations.
Manually
A Grid Case Group can be created from the context menu available when right-clicking a Result Case, Input Case or a different Grid Case Group. Source Cases can then be added by using the mouse to drag and drop cases with equal grids into the Grid Case Group’s Source Case folder. This is useful if you want to create statistics based only on a subset of the source cases in an already created Grid Case Group.
Drag and Drop of cases will normally copy the cases to the new destination, but moving them is possible by pressing and holding the Shift key while dropping.
Viewing Special Source Cases
To reduce the number of views, only a view for the first case is created automatically. If you want to inspect the results of a particular source case, right-click the case and select New view from the context menu. A new 3D View will the be created on that particular case.
How to limit system resource allocation
To reduce memory usage, project loading time etc. remember to delete the 3D Views you do not need. 3D Views uses a lot of system resources.Statistics
After creating a grid case group, an empty Statistics Case is created for you in the Derived Statistics folder of the Grid Case Group.
Setting Up and Calculate
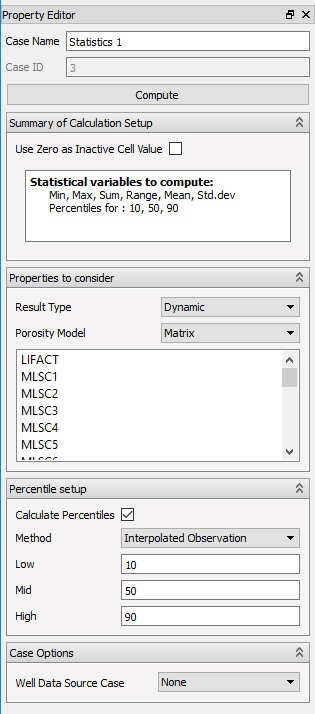
The properties of non-calculated and calculated Statistics Case is shown below:
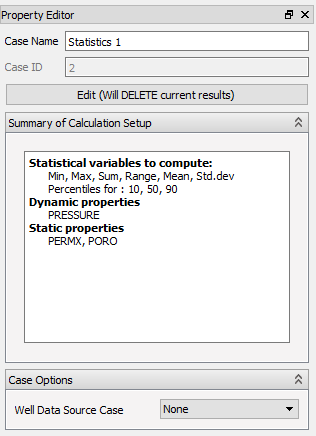
- Compute – Starts to calculate requested statistical Properties.
- Edit – Deletes the calculated results, and makes the controls to edit the setup available.
- Summary of calculation setup – Summarizes what to calculate.
- Properties to consider – These options makes it possible to select what Eclipse properties to include in the Statistical calculations. Adding variables increase the memory usage and the computational time.
- Percentile Setup – Selects whether to calculate percentiles, what method and what percentile levels should be used. Turning this off speeds up the calculations.
- Well Data Source Case – This option selects which set of Simulation Wells to be shown along with the statistical results. You can select one of the Source Cases.
Percentile Methods
Three Percentile methods are implemented:
- Interpolated Observation – The values are sorted, and the two observations representing the probabilities closest to the percentile are interpolated to find the value for the percentile. This is the default method.
- Nearest Observation – The values are sorted, and the first observation representing a probability higher or equal to the percentile probability is selected as the value for the percentile. This method is by some considered to be statistically more puristic.
- Histogram based estimate – A histogram is created and the percentile is calculated based on the histogram. This method will be faster when having a large number of realizations, because no value sorting is involved. You would however need several hundred realizations before this method should be considered.
Viewing the Results
When the computation is complete, you have to create a 3D View on the Statistics Case to view the results. Use the Context menu available by right-clicking the Statistics Case to create it.
Adding Statistics Cases
A new statistical calculation can be created by activating the context menu for Derived Statistic->New Statistics Case.