The color mapping of the displayed cell result is controlled by the Color Legend located below a result node in the Project Tree. The legend can be shown or hidden by checking or unchecking the box in front of the Legend Definition.
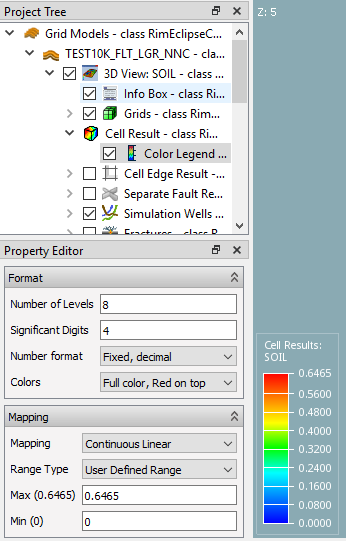
- Number of levels – Defines the number of tick marks displayed next to the color legend
- Significant digits – Defines the number of significant digits in the number formatting
- Number format – Defines how the numbers are formatted
-
Colors – Defines the color palette
- Mapping – This option defines how the values are mapped onto the color distribution
- Discrete Linear – Legend divided into linear levels defined by Number of levels
- Continuous Linear – Continuous linear legend with tick mark count defined by Number of levels
- Continuous Logarithmic – Continuous logarithmic legend with tick mark count defined by Number of levels
- Discrete Logarithmic – Logarithmic legend divided into levels defined by Number of levels
- Category – Special legend with one level for each category, either integer values or formation names.
Only available for result names ending withNUMor formation names.
- Range type
- All Timesteps – values for all time steps are used to find min and max value of
the result values represented by the color legend.
(Not available for Flow Diagnostics results) - Current Timestep – use current (one) time step to find min and max values
- User Defined Range – user specifies numeric values for min and max
- All Timesteps – values for all time steps are used to find min and max value of
the result values represented by the color legend.
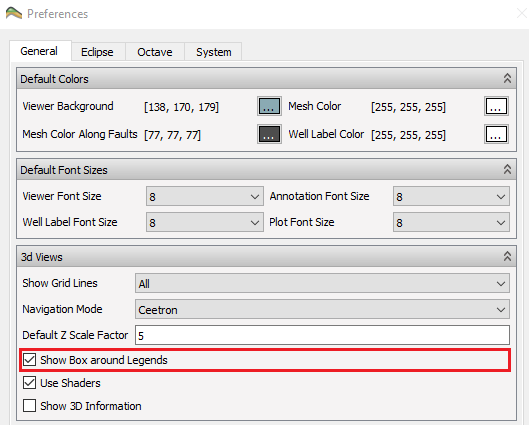
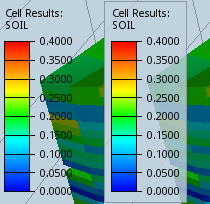
Furthermore the legend can have a semi-transparent background applied to it by selecting the *Show Box around Legends option in the Preferences dialog.