
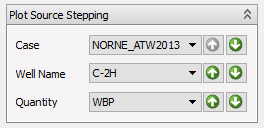
Summary Plot Source Stepping
Summary Source Stepping is a function which lets the user step through multiple vectors in one click. This function is available from both the toolbar and the Summary Curves property editor under a Summary Plot item in the Main Plot Window Project Tree.
This functionality applies both to single summary curves and ensemble curve sets.
The toolbar version may look like this

and the property editor version may looks like this
In some cases some of the stepping components are hidden, depending on the set of summary curves currently visible. When ResInsight decides which stepping component to display, all visible curves in the current plot are taken into account. If, for instance, all curves display data from the same well, the well stepping component is displayed. This policy applies to the following source dimensions:
- Cases
- Wells
- Well groups
- Regions
- Vectors/Summaries
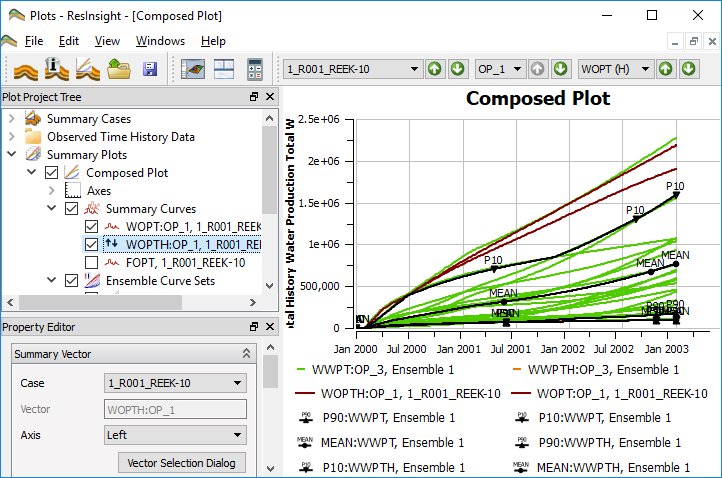
Tag selected curve item for source stepping
If the plot contains a mix of different curves, ResInsight might end up with too few stepping components available. Then, by selecting a summary curve or ensemble curve set, and activation of the context menu item Set as Source Stepping Curve, will use the selected curve as basis for data source stepping. All source stepping components for the selected curve is dispayed. When a curve or ensemble is marked for source stepping, an source stepping icon is displayed next to the curve.
Select Clear Source Stepping Curve to leave this mode.
This functionality applies both to single summary curves and ensemble curve sets.
Handling of summary curves and history summary curves
If a plot displays both a summary curve and the corresponding history summary curve, the source stepping can be applied to both curves at the same time. If you have a mix of several curves, it might be required to mark one of the curves using Set as Source Stepping Curve.
Applying data source change
When one of the next buttons are clicked, all curves are changed to display data for the next item for the clicked source dimension. Example: The user clicks the next well button. Then the well source for all curves in the current plot are changed to display data for the next well.