
An ensemble is a group of cases that are tightly coupled, only a set of ensemble input parameters differ between cases. This makes it relevant to perform calculations and statistics analysis on ensembles.
Import
There are several ways to import an ensemble:
- Use the Import Ensemble command in the window menu
- Use the Import Summary Case group and then convert the group to an ensemble
- Import a number of summary cases, move them into a group and then convert the group to an ensemble
During import of a summary case, ResInsight tries to find an associated parameters.txt file or runspecification.xml file containing ensemble parameters. If found, the ensemble parameters are stored together with the summary case. When the user adds a summary case to an ensemble, then ResInsight will perform ensemble parameters validation. A warning dialog is displayed in the following cases:
- One or more of the cases in the ensemble have no ensemble parameters
- The list of ensemble parameters differ between cases in the ensemble
Plotting
Ensembles are plotted in the summary plot the same way as ordinary summary curves. Create a new summary plot using the summary plot editor. Imported ensembles will appear in a separate group in the list of summary cases. When an ensemble is selected, a new curve set is created and plotted as multiple summary curves. By default all curves in an ensemble curve set will have the same color. The coloring mode may be edited in the curve set’s property editor in the project plot tree view. Two coloring modes are available:
- Single color Use the same color for all curves in a curve set
- By Ensemble Parameter One ensemble parameter is selected to control coloring. The ensemble parameter value for each case is used to pick a color in a color range. In this case a color legend appears.
Stepping of data source for ensemble curves is described in Summary Plot Source Stepping
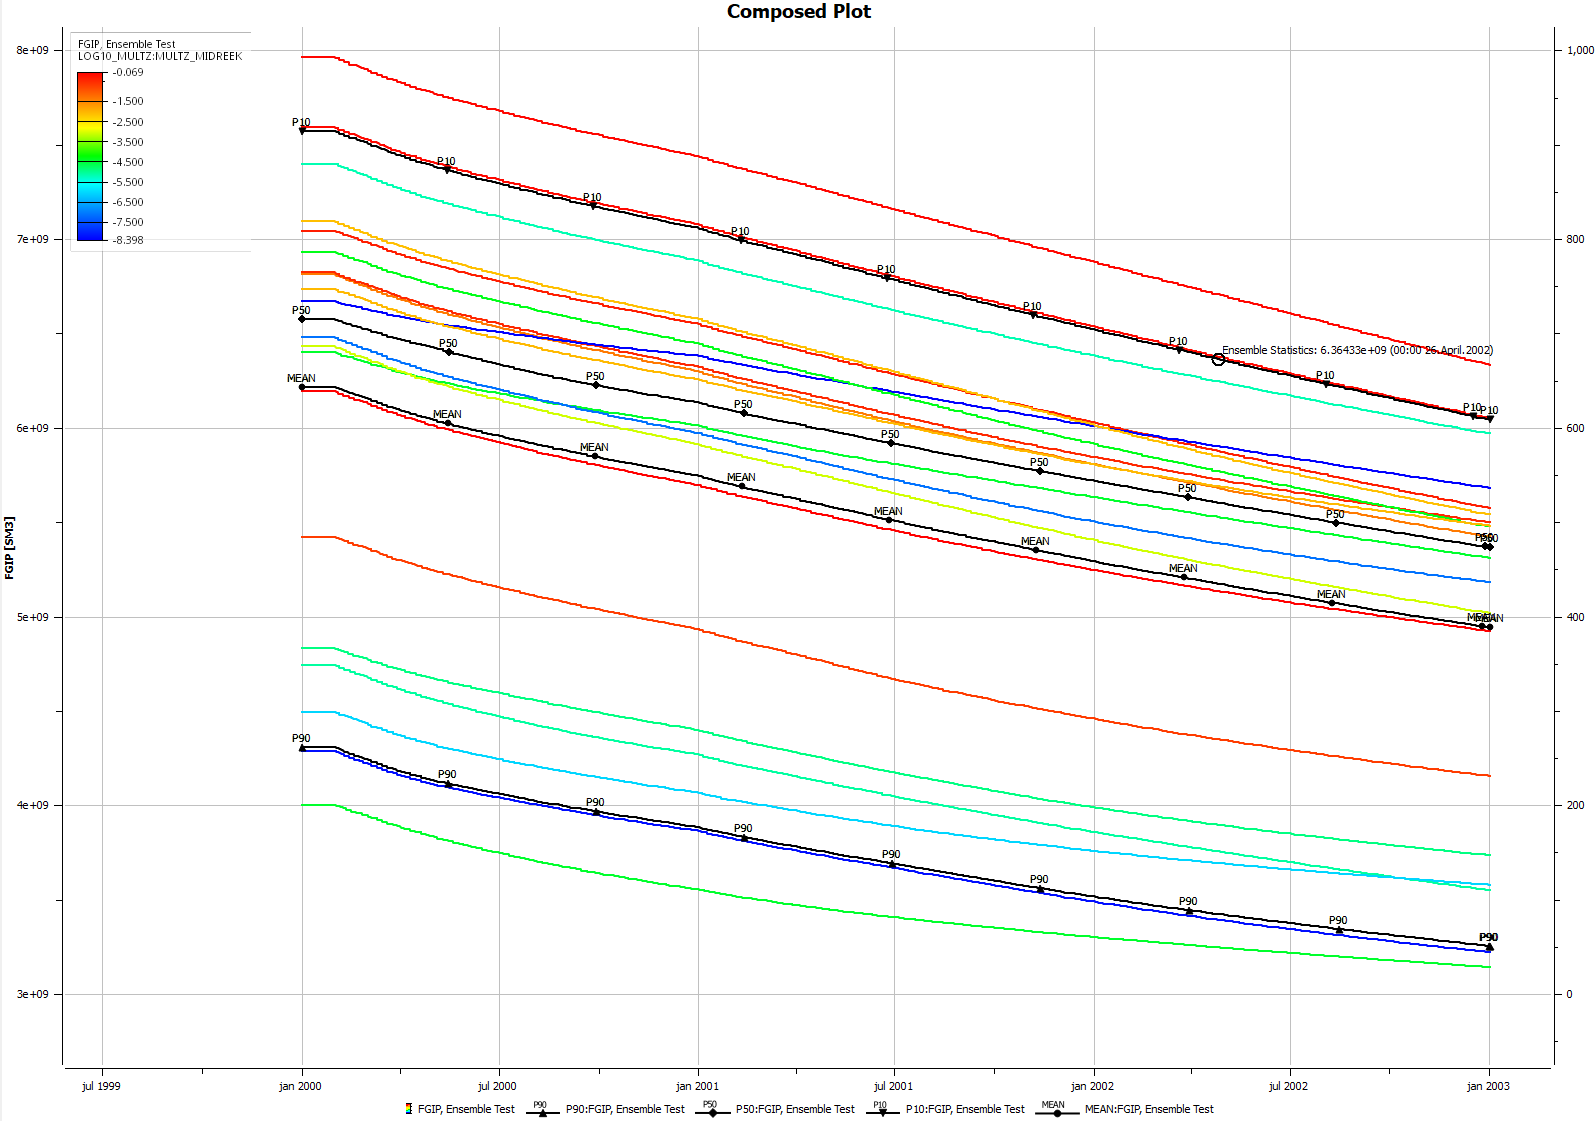
Statistics curves
If the number of curves in a curve set is sufficient, ResInsight will calculate statistics for the curve set. The following statistics curves may be displayed:
- P10 – 10% of the curves in the curve set are above this curve
- P50 – 50% of the curves in the curve set are above this curve
- Mean – Aritmetic mean for the curves in the curve set
- P90 – 90% of the curves in the curve set are above this curve
Statistics curves may be toggled on or off in the curve set’s property editor.
Example:
Derived Ensembles
New ensembles can be created based on calculations on two or more ensembles. Such ensembles are called ‘derived ensembles’. A derived ensemble will contain data which are either the sum or difference between two other ensembles. An existing derived ensemble may be input to a new derived ensemble, making it possible to for instance add more than two ensembles.
To create a derived ensemble, select two existing ensembled in the project tree. Right click and select New Derived Ensenble. A new derived ensemble is created with the two selected ensembles as input and a default arithmetic operator. In the property for the new ensemble, both input ensembles and operator can be modified.
If the two input ensembles differs in which cases they consist of, ResInsight will display a warning and let the user decide whether to create the derived ensemble or not.