
A Summary Cross Plot is a window displaying a graph in the main area of the Plot Main Window. It is very similar to an ordinary Summary Plot, but there are some differences:
- Summary Cross Plot displays one vector against another vector, not one vector against time.
- Not possible to paste Excel/CSV data to a summary cross plot.
- Summary cross plots have no Plot Editor.
The only way to create a new Summary Cross Plot, is to select the context command  New Summary Cross Plot on the Plot Main Window -> Project Tree -> Summary Cross Plots item.
Summary Cross Plot Curves
New Summary Cross Plot curves are created by using the context command  New Summary Cross Plot Curve on a summary cross plot. To be able to display a Summary Cross Plot curve, ResInsight needs two data vectors, which are selected using the Summary Cross Plot Curve property editor.
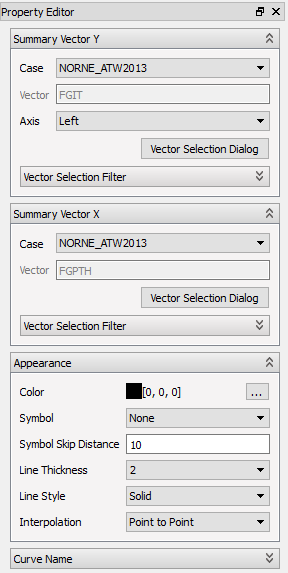
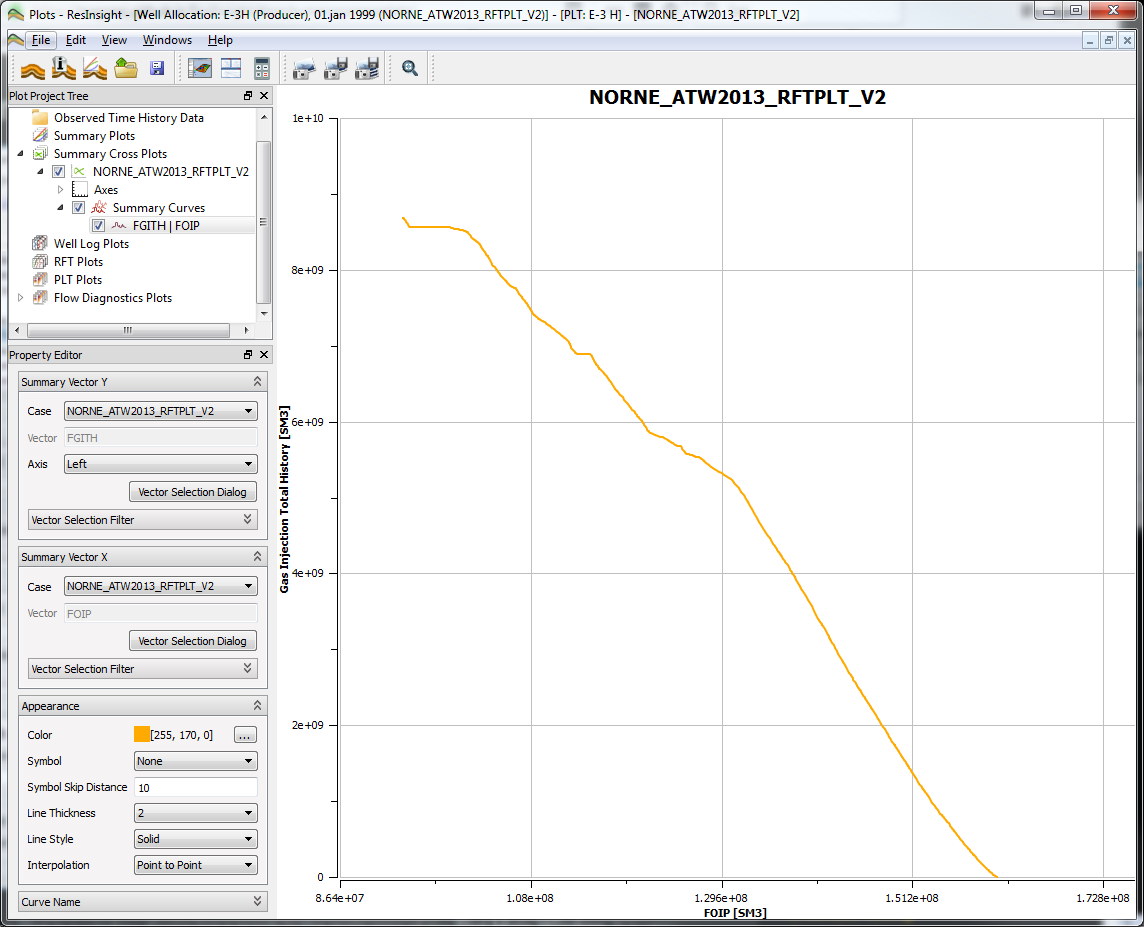
In this property editor, the editor group called Summary Vector, has been replaced by two vector selection groups Summary Vector Y and Summary Vector X, compared to an ordinary summary plot. Like the other property editor groups, the vector selection groups works the same way as in the ordinary summary plot. However, there is one exception. The Summary Vector X group is missing the Axis field. This is because the X values have one axis only, below the plot, as opposed to the Y values, which have the left and right axis. See the detailed description.
Cross Plotting
Cross plotting creates a new vector from two input vectors. Each vector entry in the resulting vector consists of one vector item value from each of the two input vectors, having equal time steps. However, in most cases the two input vectors do not share the same time steps. To be able to create a resulting cross plot vector in such cases, linear interpolation between adjacent input vector items is being used.
When a current time step T in input vector A is not found in input vector B, ResInsight interpolates between the time steps before and after T in vector B. In this way, ResInsight calculates an interpolated value for time step T from vector B. The same happens when a time step in vector B is not found in vector A.
If either the value at the current time step or one of the values involved in interpolation are NULL, the resulting vector will have a NULL value at the current time step. This is displayed as a ‘hole’ in the cross plot curve.