
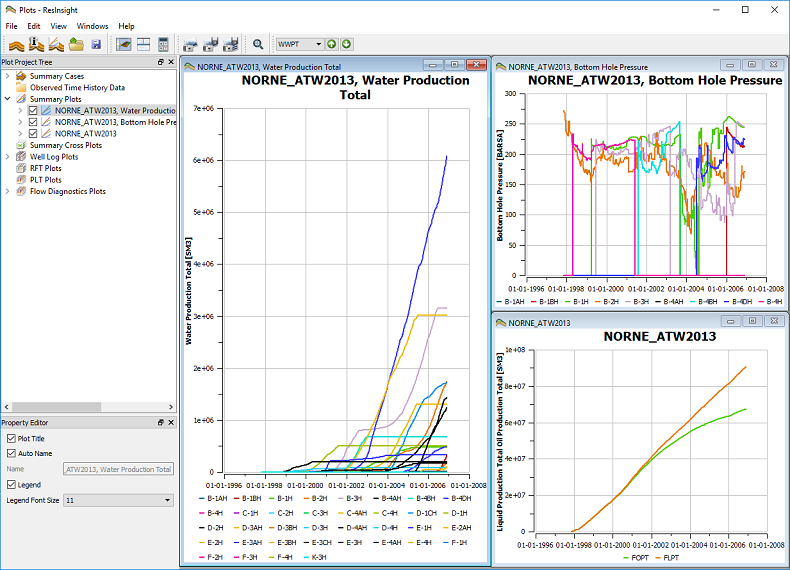
A Summary Plot is a window displaying a graph in the main area of the Plot Main Window. It can contain Summary Curves, Grid time history curves and pasted ascii curves ( See below ).
A new plot can be created by using the context menu of a plot selecting  New Summary Plot. The Summary Plot Editor dialog will then open.
Plot Data
ResInsight can create summary plots based on vectors from SUMMARY files ( *.SMSPEC ), imported Observed Time History Data, Grid Cell Time history Curve and pasted ascii curves.
SUMMARY Files
When opening an Eclipse case in the 3D view, the associated summary file is opened automatically by default, and made available as a Summary Case. Summary files can also be imported directly using one of the following commands in the File->Import->Summary Cases menu:
- Import Summary Case: Brings up the standard file selection dialog. Multiple selections are allowed.
- Import Summary Cases Recursively: Brings up the recursive file selection dialog. This dialog is described in details below
- Import Summary Case Group: Brings up the recursive file selection dialog. All files selected are automatically grouped in ResInsight.
- Import Ensemble: Similar to the above, but in addition to just create a group, ResInsight performs some extra checking related to ensembles and converts the group to an ensemble. See ensemble support description.
These commands can also be accessed in the right-click context menu for the Summary Cases entry in the Plot Main Window Project Tree under which the imported cases will also be listed.
During summary file import, ResInsight checks whether the summary file is restarted, i.e. has an origin file. If an origin file is found, the Origin Files dialog is displayed. Origin file support is described below.
Summary Case Groups
A selection of cases can be grouped by right-clicking a selection of summary cases and selecting the command Group Summary Cases. Summary cases can also be drag-dropped between summary groups. The groups will be used when listing the cases in the Summary Plot Editor.
Observed Data
See Observed Time History Data
Grid Cell Time History Curve
Time history curves from a grid cell property can also be added to a Summary Plot. See Result Inspection.
Pasted Ascii Curves
You can copy an ascii table directly from Excel or any text source and paste it directly into a Summary Plot using the command Paste Excel Data to Summary Plot. See Paste Excel Time History Data.
Plot Settings
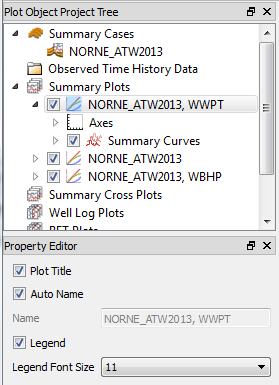
Most of the settings for the Plot itself is controlled by its sub items in the Property Tree:
- Time Axis – Controls the properties for the time axis (font size, title text, time range)
- Left Y-axis – Controls the properties for the left Y-axis
- Right Y-axis – Controls the properties for the right Y-axis
Time Axis Properties
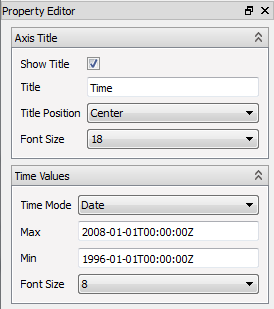
- Axis Title
- Show Title – Toggles whether to show the axis title
- Title – A user defined name for the axis
- Title Position – Either Center or At End
- Font Size – The font size used for the axis title
- Time Values
- Time Mode – Option to show the time from Simulation Start, or as real date-times.
- Time Unit – The time unit used to display Time From Simulation Start
- Max/Min – The range of the visible time in the Plot in the appropriate time unit.
The format of dates isyyyy-mm-ddThh:mm:ssZ - Font Size – The font size used for the date/times shown at the ticks of the axis
Y-axis Properties
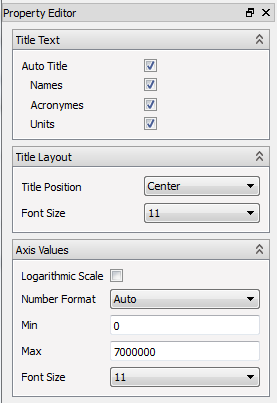
- Axis Title
- Auto Title – If enabled, the y-axis title is derived from the vectors associated with the axis. Long names, acronymes and unit can be used.
- Names – Use the long name of the quantities
- Acronymes – Add the shortname/acronyme of the quantities
- Title – If Auto Title is disabled, the plot title is set using this field.
- Auto Title – If enabled, the y-axis title is derived from the vectors associated with the axis. Long names, acronymes and unit can be used.
- Title Layout
- Title Position – Controls the position of the title. Center or At End.
- Font Size – Defines the font size used by the axis title.
- Axis Values
- Logarithmic Scale - Draw plot curves using a logarithmic scale.
- Number Format – Defines how the legend numbers are formatted.
- Auto – Legend numbers are either using a scientific or decimal notation based on the number of digits of the value
- Decimal – Legend numbers are displayed using decimal notation.
- Scientific – Legend numbers are displayed using scientific notation (ie. 1.2e+6).
- Number of Decimals – Controls the number of digits after “.” (for Decimal or Scientific format options).
- Scale Factor – “Moves” the scale value away from the values along the axis and into the unit on the axis title (for Decimal or Scientific format options).
- Max and Min – Defines the visible y range.
- Font Size – The font size used for the values shown at the ticks on the axis.
Plot Mouse Interaction
- Value Tracking – When the mouse cursor is close to a curve, the closest curve sample is highlighted and the curve sample value at this location is displayed in a tooltip.
- Selection – Left mouse button click can be used to select several of the parts in the plot, and display them in the Property Editor:
- The closest curve.
- Each of the Plot Axes.
- The Plot itself if none of the above is hit and the Plot window is activated by the mouse click.
- Window Zoom – Window zoom is available by dragging the mouse when the left mouse button is pressed. Use
 Zoom All to restore default zoom level.
 - Wheel Zoom – The mouse wheel will zoom the plot in and out towards the current mouse cursor position.
Accessing the Plot Data
The command context command Show Plot Data will show a window containing the plot data in ascii format. The content of this window is easy to copy and paste into Excel or other tools for further processing.
This dialog supports plot data displayed by day, week, month, Quarter, half year and year.
It is also possible to save the ascii data to a file directly by using the context command Export Plot Data to Text File on the plot.
Summary Curves
Summary curves are normally created using the Plot Editor see Summary Plot Editor, but can be created directly using the context menu in the Main Plot Window Project Tree. Right click a Summary Plot, the Summary Curves folder or an existing curve and select the command  New Summary Curve.
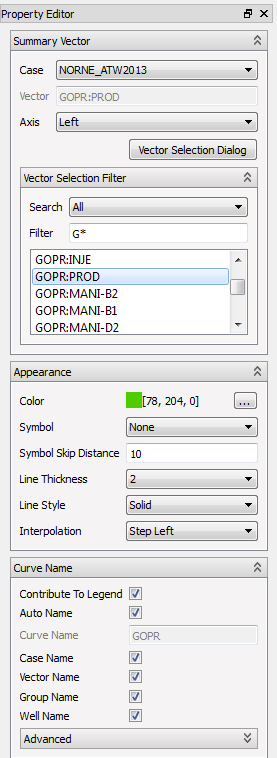
The property panel is divided in three main groups of options:
- Summary Vector – Options selecting the value to plot.
- Appearance Settings – Options controlling the color, symbol etc of the curve.
- Curve Name Configuration – Controls how the curve is labeled in the legend.
Summary Vector
This group of options is used to define the summary vector data that the curve will display.
- Case – Selects the imported Summary or Observed Data case to use as source.
- Vector – Displays a short name/ acronyme of the selected vector.
- Axis – Controls whether the curve is to be associated with the left or right Y-Axis.
To optional ways to select the curve data are available: The Vector Selection Dialog and the Vector Selection Filter.
The first is accessed by clicking the button Vector Selection Dialog. This opens a dialog similar to the one used as Plot Editor. See Summary Plot Editor.
The Vector Selection Filter group of options is a different way of selecting the curve data:
- Search – This option controls the filtering mode. Several are available and controls witch search fields that are made available. The search modes are described below
- Options depending on Search Mode – Described below.
- List of vector names – This list displays the set of vectors filtered by the search options. Use this to select which of the vectors you want to plot.
In the following, all the search fields are wildcard-based text filters. An empty search string will match anything: any value or no value at all. A single * however, will only match something: There has to be some value for that particular quantity to make the filter match.
The Vector Name field will match the name of the quantity itself, while the additional mode specific fields will match the item(s) being addressed.
Search Modes with Filter Fields
- All – A wildcard search filter applied to the colon-separated string that describes the complete vector. Eg.
"*:*, 55, *"or"WBHP:*". This mode is the default.- Filter – The actual filter text to apply
- Field – Select Field related vectors only
- Vector name – Filter for Field related vector names
- Well – Select Well related vectors only
- Vector name – Filter for Well related vector names
- Well name – Well name filter
- Group - Select Group related vectors only
- Vector name – Filter for Group related vector names
- Group name – Group name filter
- Completion – Select Completion related vectors only
- Vector name – Filter for Completion related vector names
- Well name – Well name filter
- I, J, K – Text based filter of the I, J, K value string of the completion. Eg
"18,*,*"to find vectors with I = 18 only
- Segment – Select Segment related vectors only
- Vector name – Filter for Segment related vector names
- Well name – Well name filter
- Segment number – Text based filter of the segment numbers
- Block – Select I, J, K – Block related vectors only
- Vector name – Filter for cell Block related vector names
- I, J, K – Text based filter of the I, J, K value string of the Block.
- Region – Select Region related vectors only
- Vector name – Filter for Region related vector names
- Region number – Text based filter of the Region numbers
- Region-Region – Select Region to Region related vectors only
- Vector name – Filter for Region to Region related vector names
- Region number – Text based filter of the first Region number
- 2. Region number – Text based filter of the second Region number
- Lgr-Well – Select Well in LGR related vectors only
- Vector name – Filter for Well in Lgr related vector names
- Well name – Well name filter
- Lgr name – Lgr name filter
- Lgr-Completion – Select Completion in LGR related vectors only
- Vector name – Filter for Well in Lgr related vector names
- Well name – Well name filter
- Lgr name – Lgr name filter
- I, J, K – Text based filter of the I, J, K value string of the completion in the Lgr.
- Lgr-Block – Select I, J, K - Block in LGR related vectors only
- Vector name – Filter for cell Block related vector names
- Lgr name – Lgr name filter
- I, J, K – Text based filter of the I, J, K value string of the Block in the Lgr.
- Misc – Select vectors in the Misc category only
- Vector name – Filter for Misc category vector names
- Aquifer – Select Aquifer category vectors only
- Vector name – Filter for Aquifer category vector names
- Network – Select Network category vectors only
- Vector name – Filter for Network category vector names
- All (Advanced) – This is a complete combined search mode with all the different search options available to create advanced cross item type searches.
Curve Name
The user can control the curve name used in the plot legend by using these options.
- Contribute To Legend – This option controls whether the curve will be visible in the plot legend at all. A curves with an empty name will also be removed from the legend.
- Auto Name – If enabled, ResInsight will create a name for the curve automatically based on the settings in this option group.
- Curve Name – If Auto Name is off, you can enter any name here. If empty, the curve will be removed from the legend, but still visible in the plot.
- Case Name, Vector name … etc. – These options controls what part of the summary vector information to use in the curve auto-name.
Copy and Paste
Copy and Paste of selections of Summary Plots and Curves, is possible using the Project Tree Context menu and standard keyboard shortcuts (CTRL-C/CTRL-V).
Recursive summary file import
When using the standard file selection dialog, the user is limited to select files in one directory only. If the interesting files are distributed over multiple directories, the dialog has to be opened once for each directory. The recursive file selection dialog is created to circumvent this limitation. This dialog is able to search a directory tree for files matching a specified pattern.
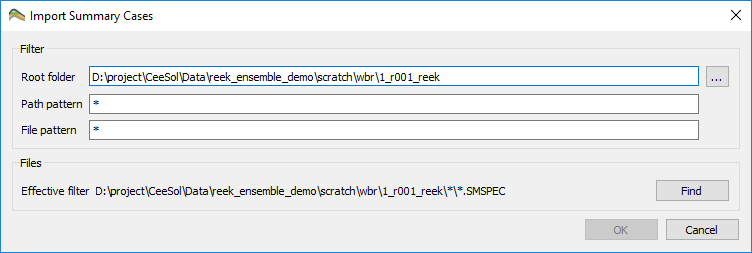
The dialog consists of the following fields:
- Root Folder: The root directory where the file search starts. Text may be entered directly into the field. Alternatively press the browse button to display the directory selection dialog.
- Path Pattern: The search pattern that applies to the start of the relative search path. If the pattern does not end with a “*”, an implicit wildcard is added silently. Supported wildcards:
- * Matches any number of any characters except the directory separator
- ? Matches one character exception the directory separator
- [abc] Matches one of the specified characters. Ex. a, b or c
- File Pattern: The search pattern that applies to the file name.
- Effective Filter: The effective filter displays the resulting full path search pattern. It is updated on the fly as the user edits the pattern fields.
After pressing the “Find” button, a file search is performed in the root directory and the directories below matching the path pattern. The files found are presented in a list, where the user can check/uncheck each file individually.
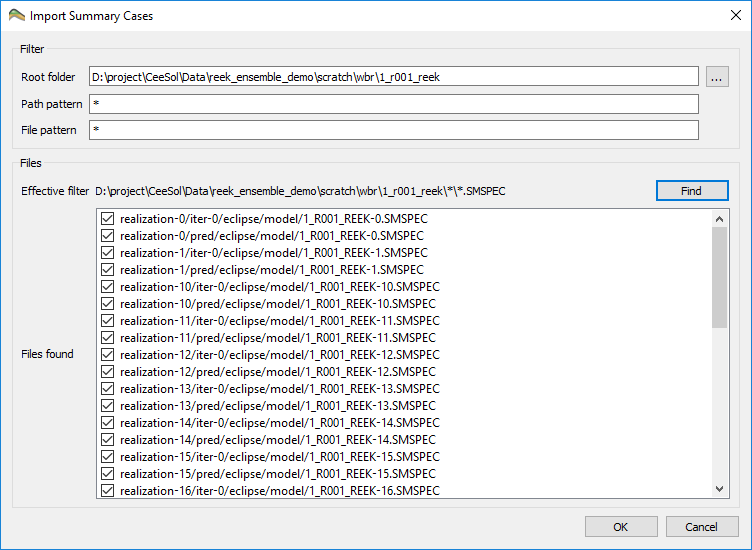
When the “OK” button is pressed, all checked files are imported.
Origin Files
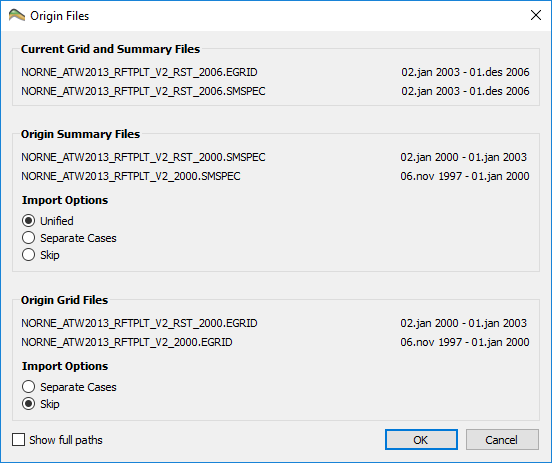
During summary file import, ResInsight checks whether the summary file is restarted, i.e. has an origin file. If an origin file is found, the Origin Files dialog is displayed.
Depending on what triggered the summary file import, the dialog shows slightly different information. If the summary file import was triggered by a grid file import, the dialog displays information about grid files in addition to the summary origin file(s). If the summary file was imported directly, information about grid files are not relevant and thus not displayed.
The dialog contents are organized in groups:
- Current Grid and Summary Files or Current Summary Files: This group displays the name of the main summary file to import. If the import is triggered by a grid file import, the name of the grid file is also displayed.
- Origin Summary Files: This group displays the names of the origin summary file(s) found. If there are more than one file listed, it means that the found origin file also has an origin file. ResInsight will search the “chain” of summary origin files until it reaches the end.
- Import Options There are three options to control how origin summary file are imported
- Unified: The main summary files and all origin files are imported into one single summary case
- Separate Cases: The main files and all origin files are imported into separate summary cases
- Skip: Only the main summary file is imported. The origin summary files are skipped.
- Import Options There are three options to control how origin summary file are imported
- Origin Grid Files: If the summary file import was triggered by a grid file import, this group is visible. It contains a list of the grid files associated to the origin summary files
- Import Options There are two options to control how the grid files are imported
- Separate Cases: All “origin” grid files are imported into separate grid cases
- Skip: Only the main grid file is imported. The “origin” grid files are skipped.
- Import Options There are two options to control how the grid files are imported
By default the file names are displayed using relative path based on the common root folder for all files. In order to display the full path, check the Show full paths checkbox. Regardless of the checkbox state, there is always a tooltip showing the full path for every file. It is also possible to copy a full path file name to the clipboard. Right click on the file name and select Copy file name.
If the user selected multiple summary files or grid files, this dialog will be displayed for every file that has an origin summary file. In this case the button OK to All appears. When this button is clicked, the rest of the files will be imported silently using the same options.