
This section describes how wells defined in the simulation are displayed, and how to control the different aspects of their visualization.
Commands
Several commands are available as context commands on a simulation well. These commands are available either by right-clicking the well in the 3D View or in the Project Tree.
- New Well Log Extraction Curve – Creates a new Well Log curve based on the selected simulation well, the current time step and cell property. ( See Well Log Plots )
- New Well Log RFT Curve – Creates a new RFT curve in a well log plot based on the selected simulation well. This option is only present if the current simulation well has RFT data. ( See Well Log Plots )
- New RFT Plot – See [Well Log Plots](/ResInsight/docs/rftplot.
- Plot Production Rates – Creates a summary plot of the selected wells production rates, along with the bottom hole pressure.
( See Summary Plots ) - Plot Well Allocation – Creates or modifies the default Well Allocation Plot to show the well.
allocation for the selected well. If the case has no Fluxes the well flow rates are shown instead.
( See Flow Diagnostics Plots ) - Show Contributing Wells – This command sets up a 3D View by adding filters and modifying the Cell Result based on Flow Diagnostic Calculations to show which regions and wells that contribute to the selected well by doing:
- Add a property filter of Time Of Flight to/from the selected well to show only the cells that contribute to/are influenced by the well.
- Sets the Cell Result to show Tracer With Max Fraction based on All Injectors or All Producers (the opposite of the selected well)
- Toggles the visibility of the other Simulation wells to show only wells contributing to/influenced by the selected well.
- New Fracture – Creates a new fracture along the simulation well. (See Fracture instances)
- New Intersection – creates a new intersection based on the selected simulation well.
( See Well Log Plots )
Overall Settings for Simulation Wells
The Property Panel of the Simulation Wells item in the Project Tree contains options that are applied across all the wells, while the visualization of each single well can be controlled by the options in the property panel of that particular well, and will override the overall settings in the Simulation Wells item.
If an option is overridden in any of the wells, this will be indicated in the corresponding top level toggle which will be partially checked. Toggling such a setting will overwrite the ones set on the individual level.
In the following are the different parts of the Simulation Wells property panel explained.
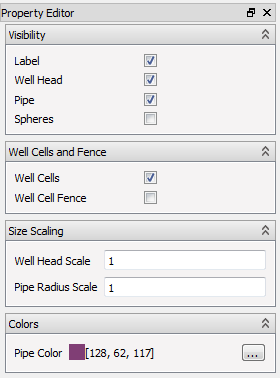
Visibility
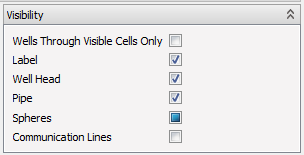
These options controls the visibility of different aspects of the simulation wells.
- Wells Trough Visible Cells Only – This option will only show wells with connections to cells deemed visible by the combined result of Range Filters and Property Filters.
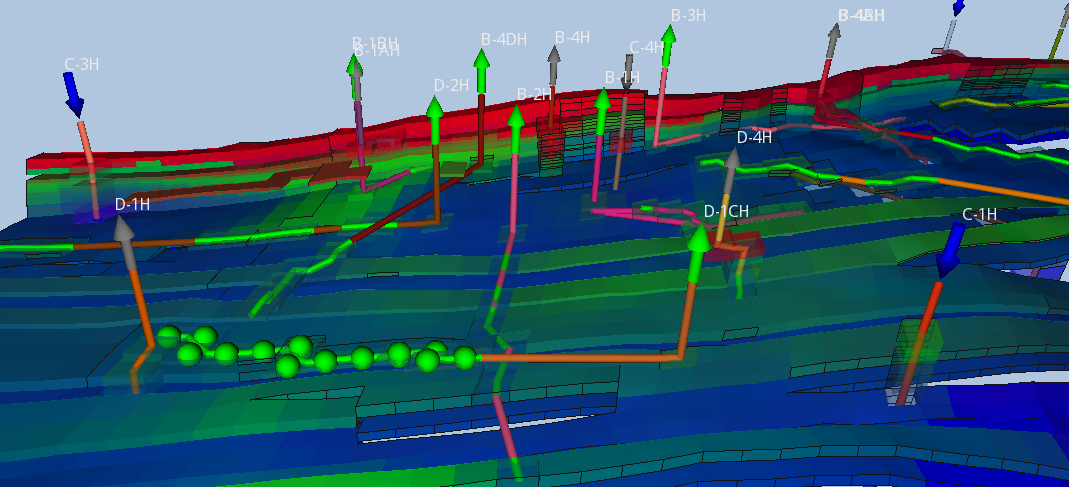
- Label – Controls visibility of well name labels in the 3D View
- Well head – Controls visibility of the arrow displaying the production status of the well
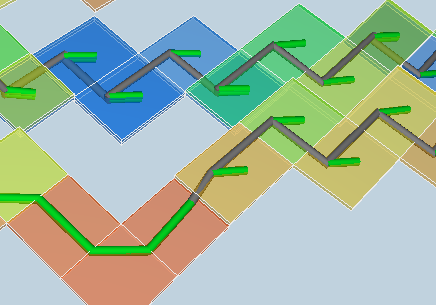
- Pipe – A symbolic pipe can be drawn between the well connection cells to illustrate the well. This option controls the visibility of the pipes.
- Spheres – This option toggles the visibility of spheres drawn at the center of each well connection cell.
- Communication Lines – Toggles the visibility of well communication lines. These arrows shows the communication between wells. Broader arrows indicate higher level of communication. These arrows are based on Flow Diagnostics calculations, and are only available if the eclipse results includes fluxes. Arrows representing communication in the opposite direction from what is expected (eg. producers supporting another well due to cross flow) are displayed in a layer “under” the other arrows, to make them easier to see.
Well Cells and Fence
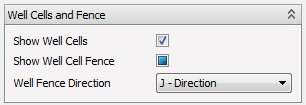
- Show Well Cells – This option toggles whether to add the well connection cells to the set of visible cells. If no cell filters are active, toggling this option will conveniently hide all other cells, displaying only the requested well cells.
- Show Well Cell Fence – This options toggles whether to add all cells in a given direction ( I, J or K) to the set of visible cells, which has a connecting cell within its set.
- Well Fence direction – Controls whether to add extensions of the well cells in the I, J or K direction to the set of visible cells
Size Scaling
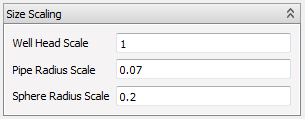
- Well Head Scale – Scales the arrow displaying the production status of the well
- Pipe Radius Scale – Scaling the pipe radius by the average i,j cell size.
- Sphere Radius Scale – Scaling connection cell spheres radius by the average i,j cell size.
Open Simulation Wells will be drawn with a slightly larger radius than closed wells. This makes open wells easier to see when they occupy the same cells as closed ones.
Colors
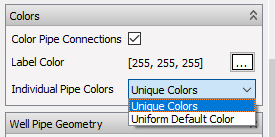
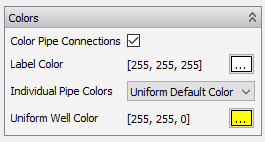
- Color Pipe Connections – Applies a red, green, blue or gray color to the section of the pipe touching a connection cell indicating the production status of the connection. Gas injection, oil production, water injection or closed respectively.
- Label Color – Sets the well label color in the 3D view.
- Individual Pipe Colors - Select how each pipe will be colored.
The Individual Pipe Color setting has two different options:
- Unique Colors – Selecting this will apply unique colors from a pre-defined color palette to all the wells, overwriting the colors they had.
- Uniform Default Color – Selecting this will apply the same color (made available in the Uniform Well Color option to all simulation wells.
Well Pipe Geometry
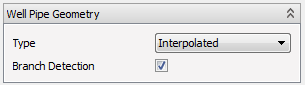
- Type – Controls whether the pipe will go from cell center to cell center or in a smoother trajectory.
- Branch Detection – Enables splitting of wells into branches based on the positions of the connection cells. This option applies to ordinary wells only and has no effect on multi segment wells (MSW).
Advanced
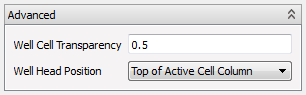
- Well Cell Transparency – Controls the transparency level for the well cells.
- Well Head Position – Controls the depth position of the wellhead. Either relative to the top of the active cells in the relevant IJ-column, or relative to the highest active cell overall.
Individual Simulation Well options
Each of the wells has a set of individual settings which corresponds to the setting on the global level. See the documentation of Overall Settings for Simulation Wells.
Except for the Size Scaling, these options will override the corresponding setting on the global level, and will result in a partially checked state on the corresponding toggle in the Simulation Wells property panel. The Size Scaling options, however, works relative to the scaling level set on the top level.
Well Pipes of Multi Segment Wells
ResInsight reads the MSW information in the result files and uses that to create a topologically correct visualization of the Multi Segment Well. Reading this information is somewhat time consuming, and can be turned off in the Preferences .
Geometry Approximation
The pipe geometry generated for MSW’s are based on the topology of the well (branch/segment structure) and the position of the cells being connected. The segment lengths are used as hints to place the branch points at sensible places. Thus the pipe geometry itself is not geometrically correct, but makes the topology of the well easier to see.
Dummy Branches
Often MSW’s are modeled using a long stem without connections and a multitude of small branches; one for each connection. ResInsight offsets the the pipe within the cell to clearly show how the topology of the well is defined.
Picking Reveals Segment/Branch Info
Branch and segment info of a MSW-connected-Cell is shown in the Result Info window when picking a cell in the 3D View. This can be handy when relating the visualization to the input files.